Syslog Message Description for CPU Overload
Whenever the device detects a CPU overload, it sends a syslog message that shows CPU utilization of the different processes (tasks) per core. This information can help in identifying the cause of the overload. When the devicedetects a CPU overload, it sends a syslog message every 10 seconds until it returns to normal state.
You can also view CPU utilization through the CLI, by using the following command: show system utilization
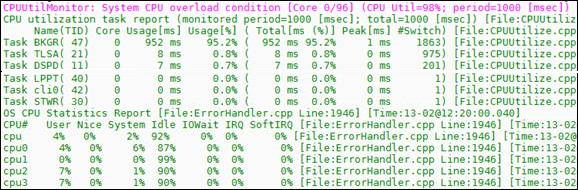
The figure below shows an example of a syslog message generated because of a CPU overload. CPU utilization information is shown under the "CPUUtilMonitor" section (shown in pink). The subsequent table describes the displayed information.
CPU Overload Fields Description in Syslog Message
|
Field |
Description |
|---|---|
| First line (shown in pink) | |
|
“Core” |
Index of the CPU core. |
|
“CPU Util” |
CPU utilization (in percentage). |
|
“period” |
Total period (in msec). |
|
Second line |
|
|
“monitored period” |
Duration (in msec) of CPU overload within the total monitored period. |
|
“total“ |
Monitored period (in msec). |
|
Statistics per task (process) in overloaded cores only Note: By default, the syslog message only shows the five most used tasks in the last period. |
|
|
“Name (TID)” |
Name of task (process). |
|
“Core” |
Index of the CPU core. |
|
“Usage [ms]” |
Total time (msec) of monitored period that the task utilized CPU. |
|
“Usage [%]” |
Percentage of time of monitored period that the task utilized CPU. |
|
“Total [ms (%)]” |
Total time (in msec) and percentage that task utilized CPU during entire period. |
|
“peak [ms]” |
Maximum lasting time (msec) that the task utilized CPU during the period. |
|
“#Switch” |
Context switch time - number of consecutive periods that were allocated for this task. |
|
Statistics per CPU core |
|
|
"CPU#" |
Index of the CPU core. |
|
"User" |
Percentage of CPU utilization that occurred while executing at the user level (application). |
|
"Nice" |
Percentage of CPU utilization that occurred while executing at the user level with nice priority (Linux systems). |
|
"System" |
Percentage of CPU utilization that occurred while executing at the system level (kernel). |
|
"Idle" |
Percentage of time that the CPU was idle (%) during which no tasks were using the CPU core. |
|
"IOWait" |
Percentage of time that the CPU was idle (5) during which tasks were using the CPU core. |
|
"IRQ" |
IRQ time (in percentage). |
|
"SoftIRQ" |
SoftIRQ time (in percentage%). |